
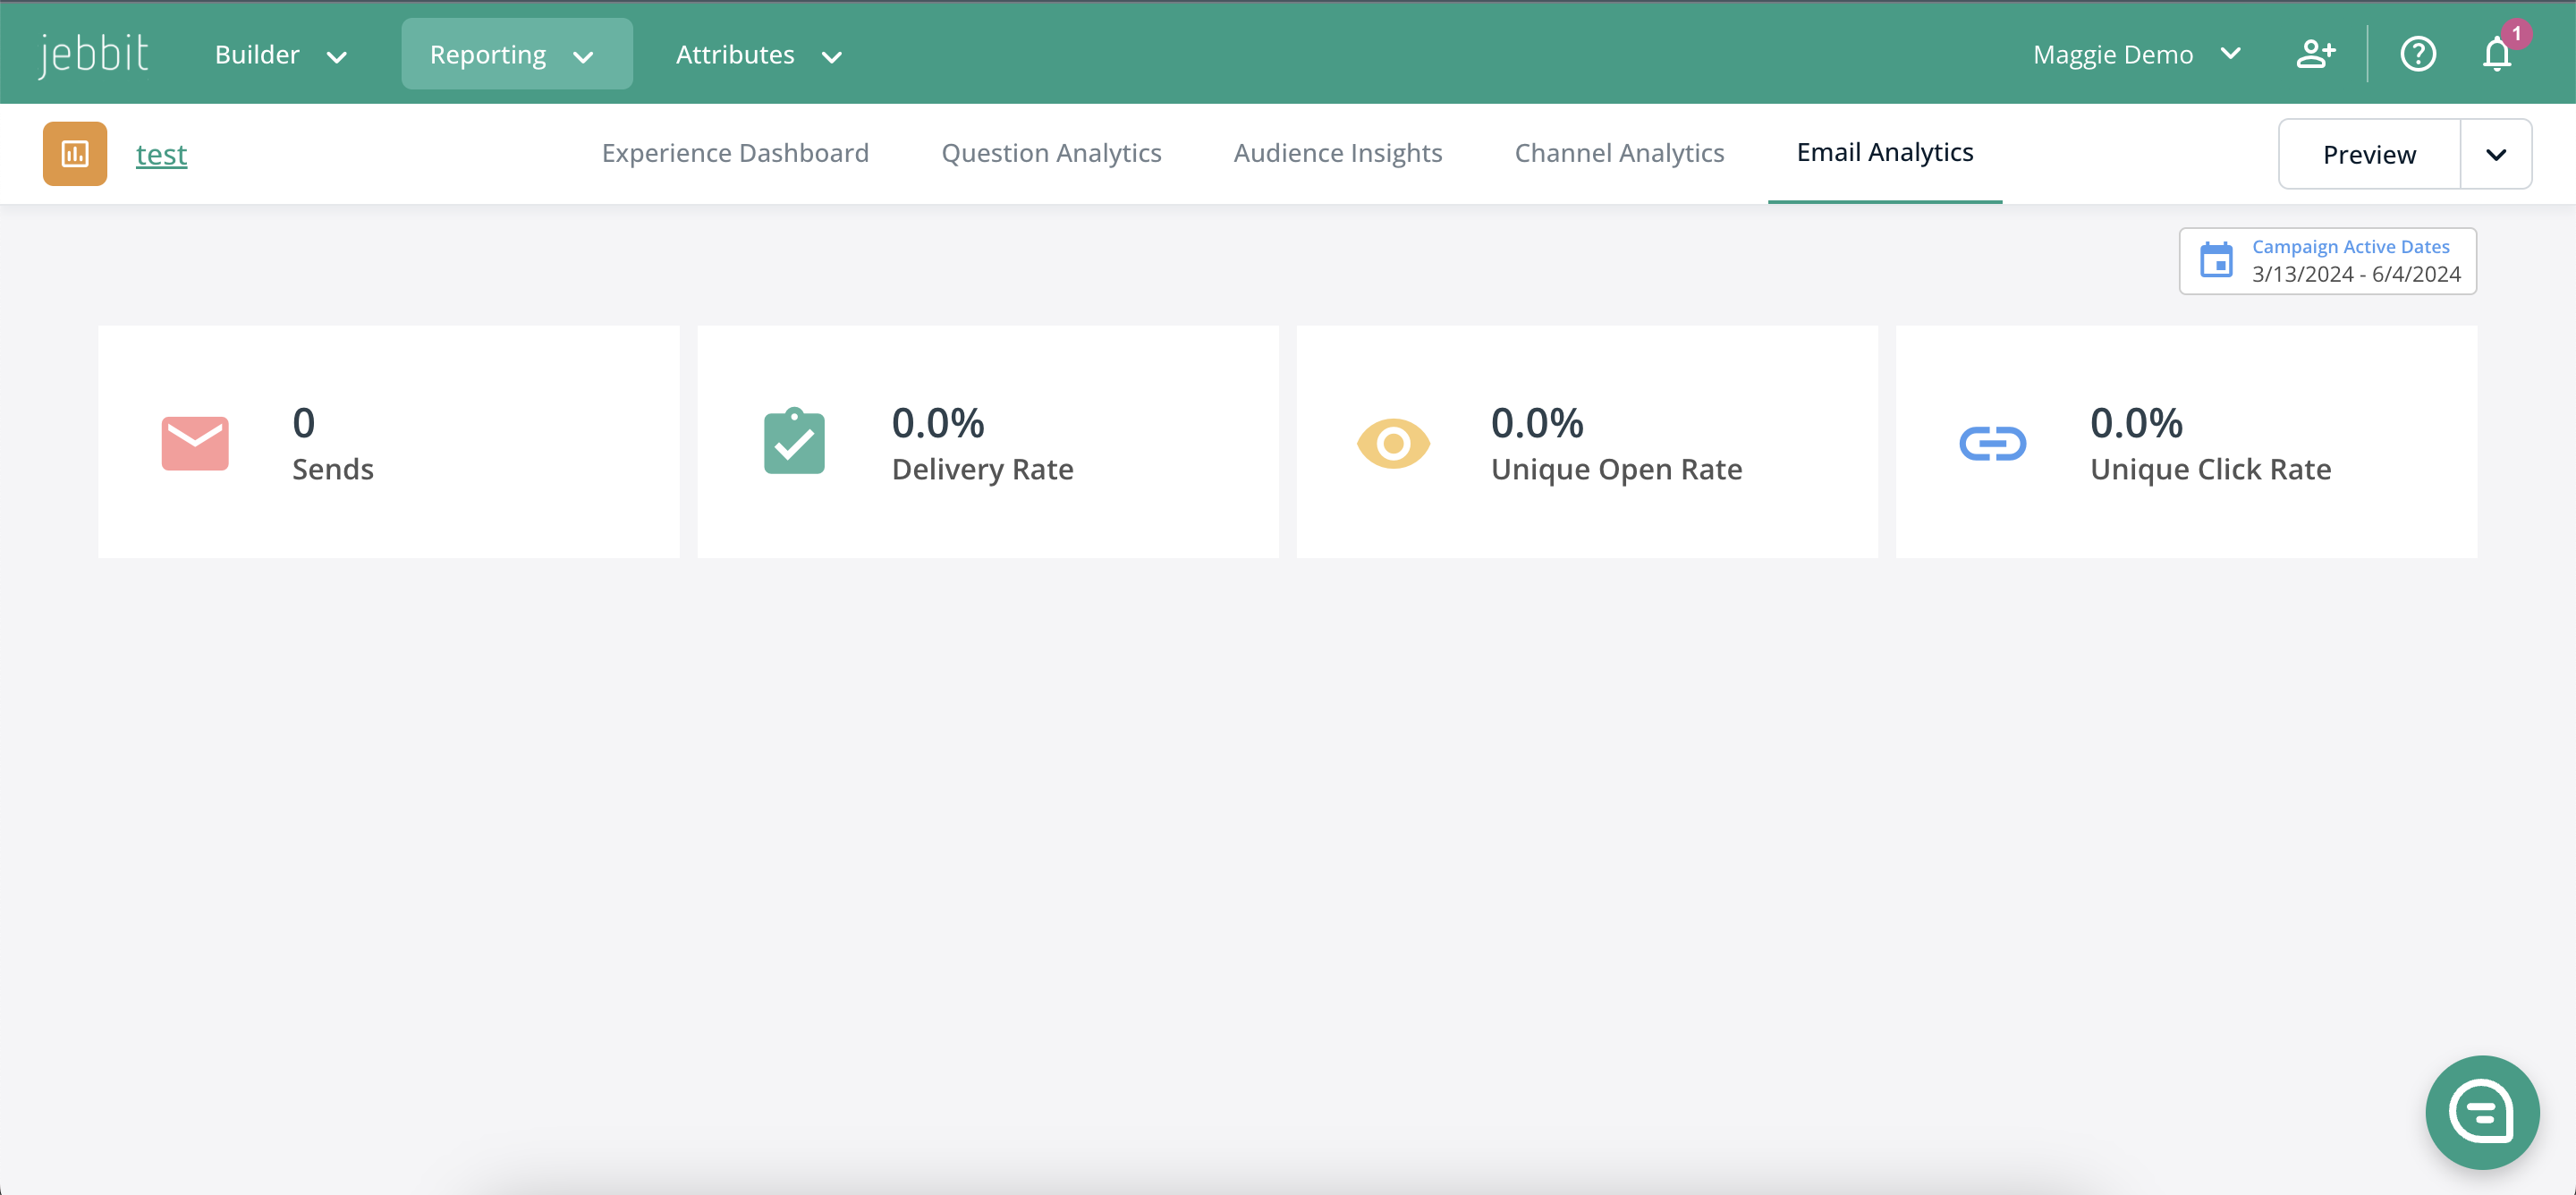
Email analytics in Experiences by Jebbit offers a comprehensive overview of email performance metrics, including Sends, Delivery Rate, Unique Open Rate, and Unique Click Rate. These insights are available for all campaigns that incorporate an Email Trigger component, enabling marketers to assess and optimize their email engagement strategies effectively.
Before you begin
Confirm your experience has an Email Trigger component.
Access email analytics
Selecting Reporting from the main navigation.
Click Experience Analytics.
Choose the experience you want to analyze.
In the selected experience, click the Email Analytics tab to view detailed metrics.
Understand experience metrics
Bar Graph Visualization: The top section displays a bar graph showing the unique open and click rates for each email sent. A horizontal line marks the average unique open rate across all emails.

Email Stats Breakdown: Below the graph, the Email Stats section details each email's performance metrics.

Metric Tooltips: Hover over any metric to see a tooltip explaining its significance.

Next steps
Use the analytics to adjust and improve your email content.
Regularly review metrics to identify trends and make strategic adjustments.